After clicking in the name of the project or workstream you see the project or workstream dashboard. This gives you an overview of important project data. You can navigate further to view and maintain the data.
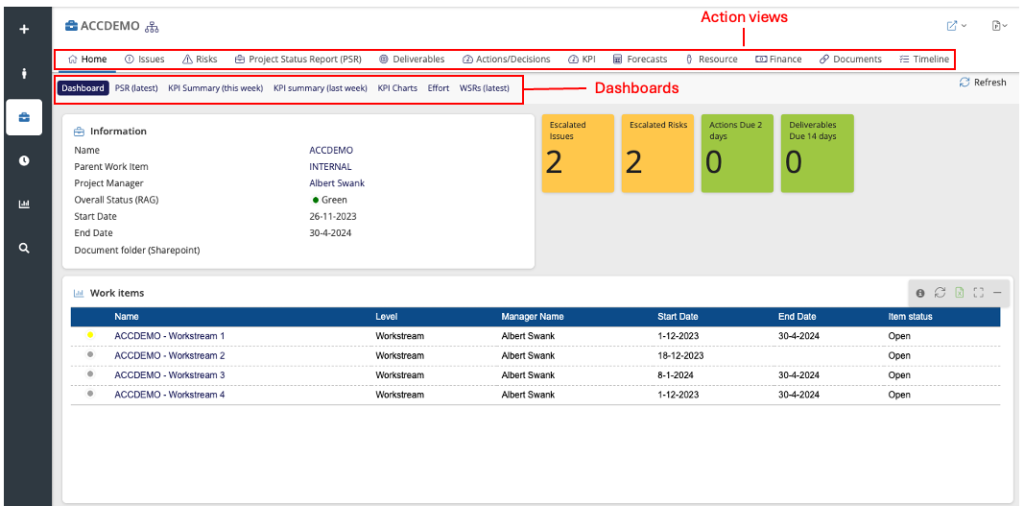
- The Action views give access to views with functionality to maintain project data. For instance the ‘Issues’ tab gives you access to the issue log.
- The Dashboards present project information grouped together to see relevant information.
- Dashboard: the main project or workstream dashboard.
- PSR: shows the PSR for the current week. (this excludes KPI data which is available in a separate dashboard view).
- KPI summary: the list of KPIs that need to be tracked for the upcoming PSR in the current week.
- KPI charts: graphs of KPIs, limited to STMP, SIS, API and total financial benefits.
- Effort: overview of planned versus actual effort per resource